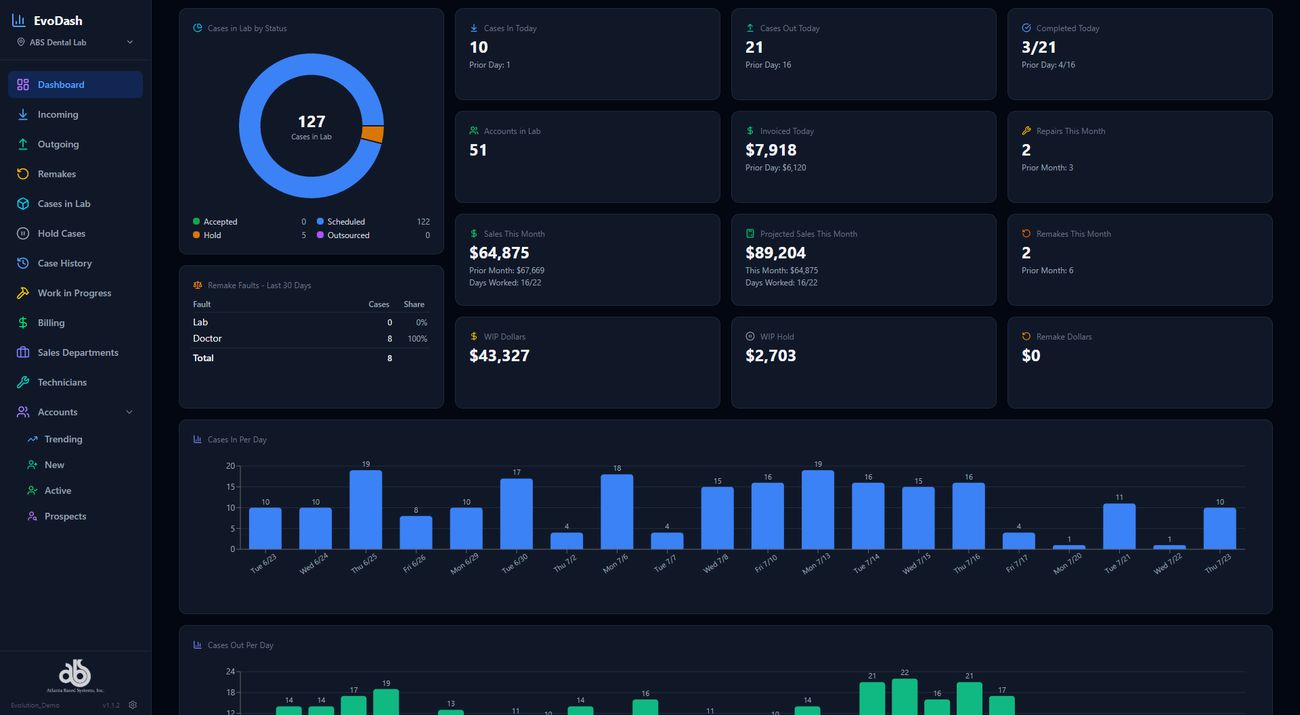
EvoDASH reads your Evolution data live, so the numbers you used to run reports for are already on screen when you sit down. Every view below is a real EvoDASH screen. Click a bar in any chart and EvoDASH shows you the cases or invoices behind it.
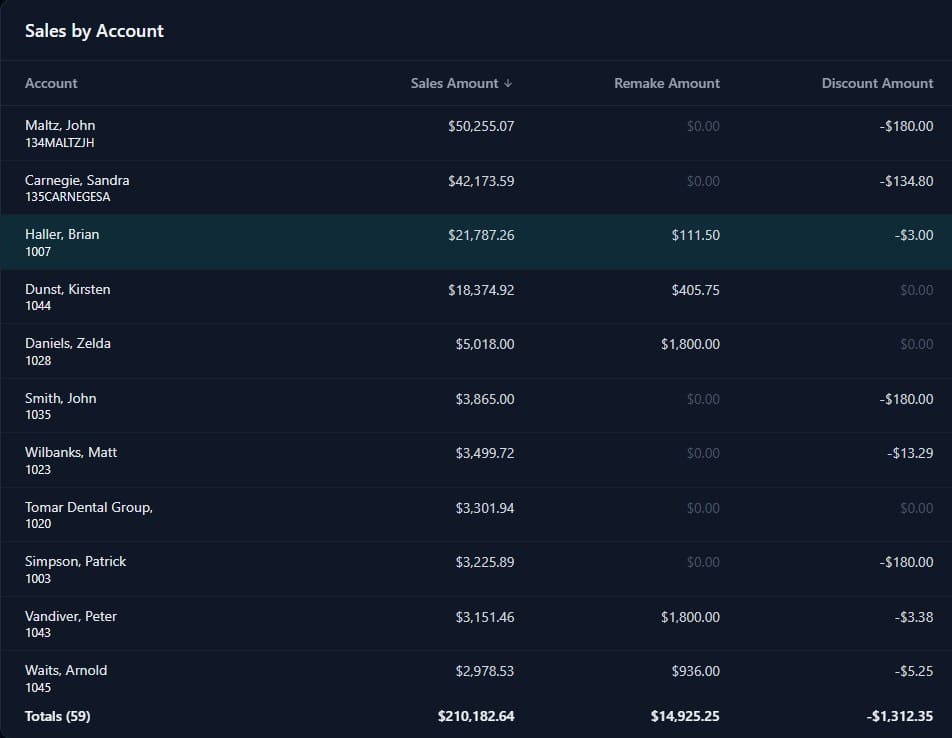
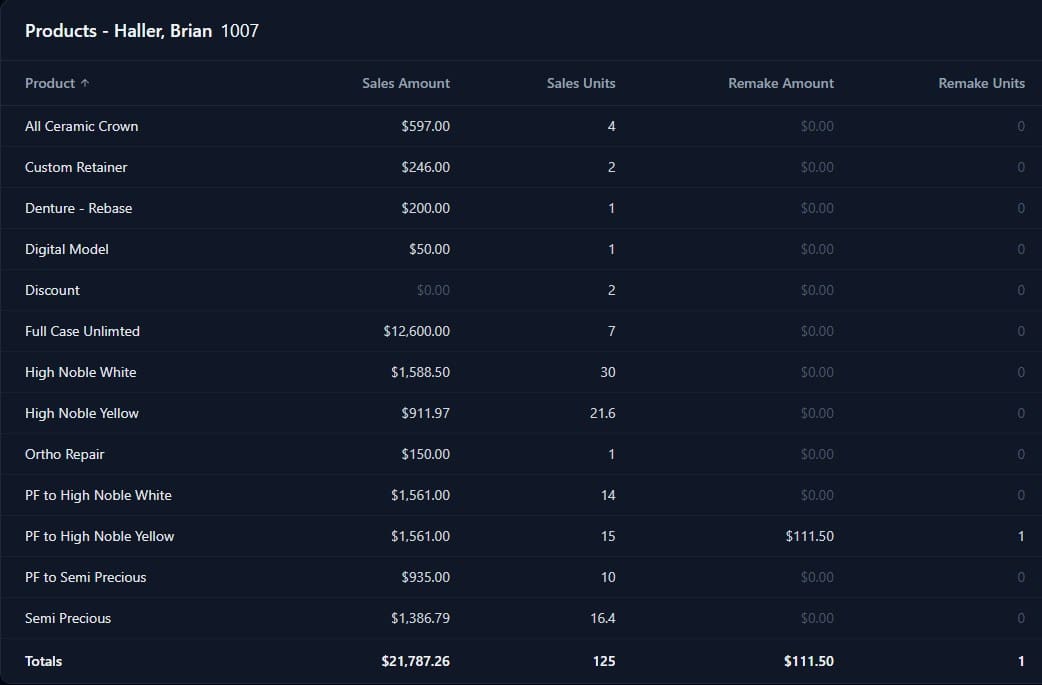
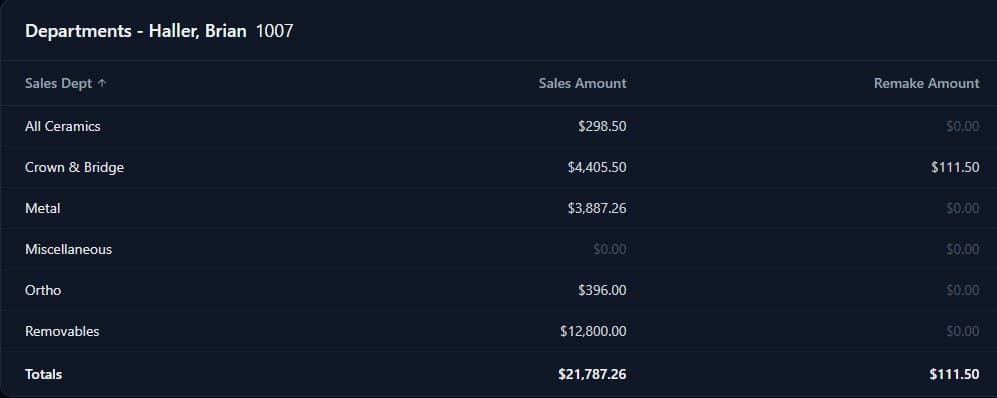
Pick a date range and see sales for every account. Click an account to see each product it bought and how its sales split across your departments. Then compare this year to last year.
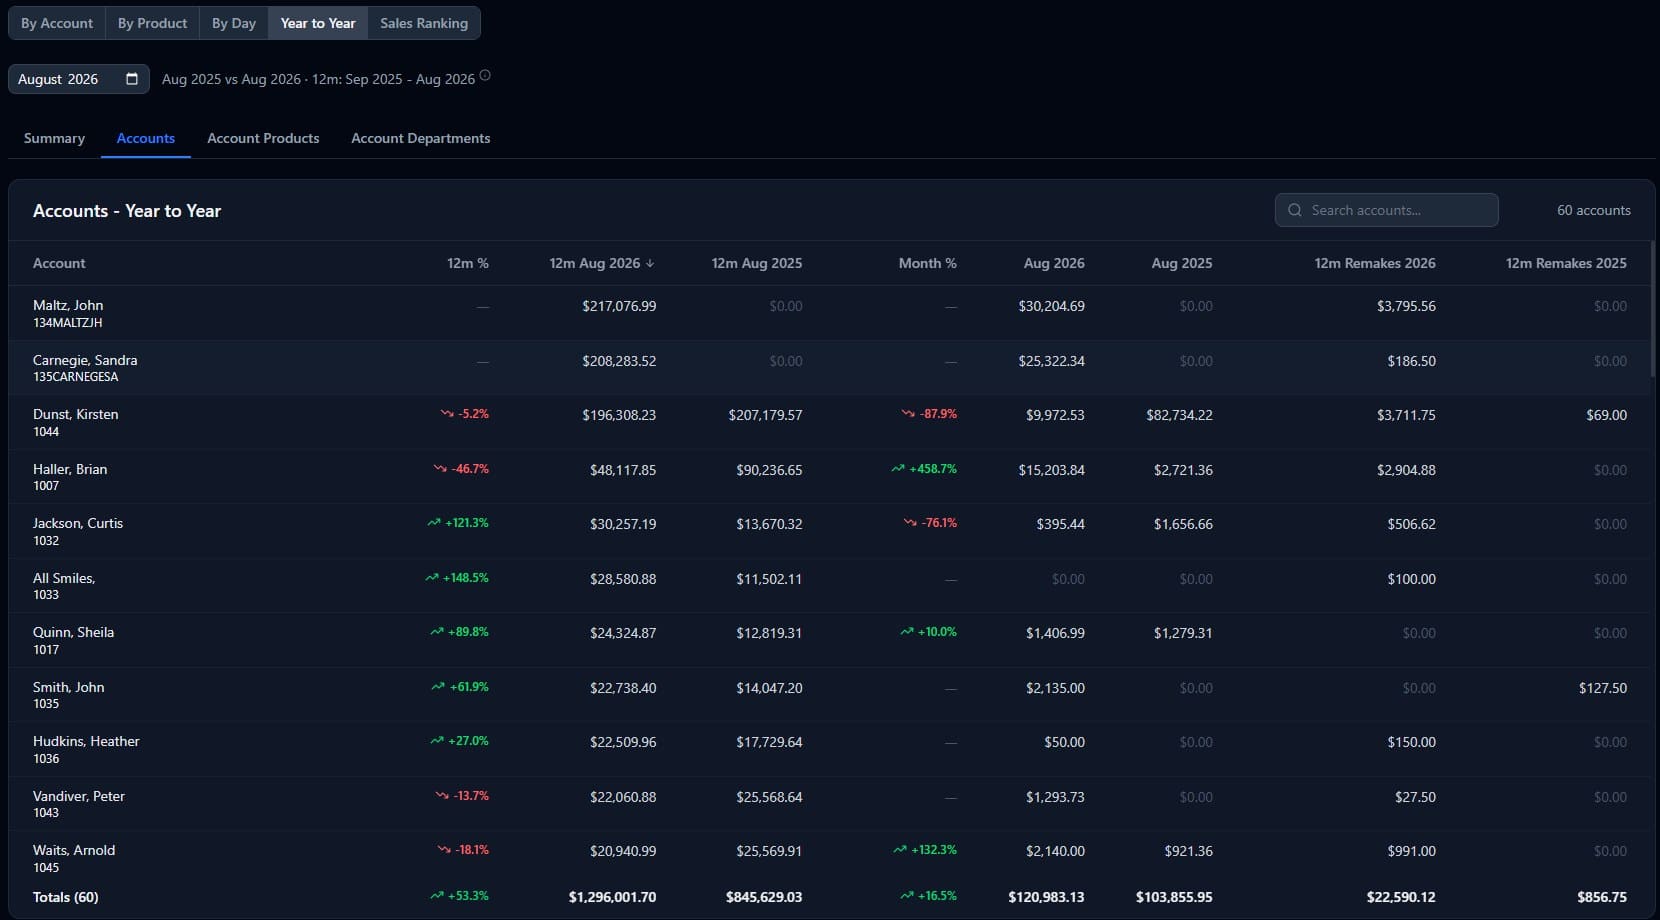
Compare a month against the same month last year, and the last 12 months against the 12 before, for accounts, products or departments. Growth shows in green and decline in red, so you can see which accounts are growing and which are slipping.
Sales History also has By Product, By Day and Sales Ranking views.
EvoDASH connects straight to your Evolution database. When a case is logged in or invoiced in Evolution, it shows up in EvoDASH.
EvoDASH only reads your data. It never writes back to Evolution, so there's no risk to your production records.
Pick the widgets that matter to you from the Widget Gallery and arrange your own dashboard. Light and dark modes are included.
“Being able to click on a case in the daily outgoing and see where it is in the lab saves so much time.”Real EvoDASH User, A Real Lab
We'll walk you through the screens your team would use most and answer your licensing questions.
Or call Adam Thomas: (800) 476-2097 ext. 231