
Tag: lab operations

Eight dental lab deals have been announced so far in 2026, one short of the pace set in 2021. That number is getting read as a signal to sell. We think it is a better signal about what makes a lab durable.

What changed in this wave

The last big consolidation cycle ran on a scale thesis. Buy labs, centralize production, pull cost out of the middle, and let the volume do the work. It worked in some cases and produced a lot of unhappy technicians in others.

The 2026 deals look different. The recapitalization of Apex Dental Laboratory Group by LongueVue Capital and Swaney Group Capital in March, and Catalis Dental Lab Partners picking up Revolution Dental Lab, JB Dental Lab and Avaneer Dental Studio, share a common characteristic. The coverage describes buyers underwriting domestic manufacturing capacity and digital capability, and treating both as competitive moats rather than overhead.

That is a real shift. Domestic production went from being the expensive option to being the defensible one, and the tariff environment did most of the work in getting it there.

The part that has nothing to do with selling

Here is why this matters to a lab that will never take a call from a banker.

If buyers are paying a premium for domestic capacity, digital workflow and provable operating performance, those three things are not deal characteristics. They are competitive characteristics. The lab down the road is not going to beat you because it got bought. It is going to beat you if it can quote faster, turn cases faster, and show a doctor a remake rate.

The first two are equipment and process decisions. The third one is where most independent labs quietly lose ground, and it is the cheapest of the three to fix.

The numbers a buyer asks for, and why you need them anyway

Due diligence on a lab is not exotic. It comes down to a handful of questions.

What is the remake rate, and does it break out by technician, by account, and by product? What does AR aging look like past 30, 60 and 90 days? What is unit throughput per technician? Which accounts are growing, and which have quietly shrunk 20% over eighteen months?

Most lab owners have a feel for all of these. Very few can produce the actual figures without a week of spreadsheet archaeology, and the figures that come out of that week describe a lab that no longer exists.

That gap is expensive long before anyone is buying anything. A remake rate that drifts from 4% to 7% costs real money for months before it shows up in a P&L. An account that slides from net 30 to net 75 does the same thing to cash. A technician whose throughput dropped after a workflow change is a problem you want to catch in three weeks, not at year end.

None of that requires a transaction to be worth knowing.

What a good version of this looks like

The labs that handle this well are not running more reports. They are running fewer, and looking at them more often.


A weekly glance at remake rate by account catches quality drift while it is still a conversation and not a lost customer. A daily look at what has been finished but not yet invoiced turns billing from a month-end scramble into a Tuesday task. Technician throughput compared week over week tells you whether the new mill actually did what the salesperson said it would.

This is the reason we built EvoDASH into the Evolution suite. Not because dashboards are interesting, but because the interval between when a number goes wrong and when a lab owner finds out is where margin disappears. Shortening that interval is most of the job.

What this means for your lab

You do not need to have an opinion about private equity to take something from this cycle. Take the checklist instead.

Pick the three numbers that would most change a decision you are making this quarter. For most labs that is remake rate, units per tech, and how much finished work is still waiting to be billed. Find out what they are this month, not last year. Then look at them again in thirty days.

If that exercise takes you a week, that is the finding. It should take a minute.

See what this looks like in practice

If you have been on Evolution a while and feel like you are not using everything you have, we do free walkthroughs. If you are evaluating a change, we are glad to show you what real-time lab visibility looks like on your own data. Either way, reach out.

Learn more about ABS and Evolution

Follow ABS on Facebook, Instagram, LinkedIn, and X. Please contact us directly if you’d like to learn more about Evolution dental lab management software.

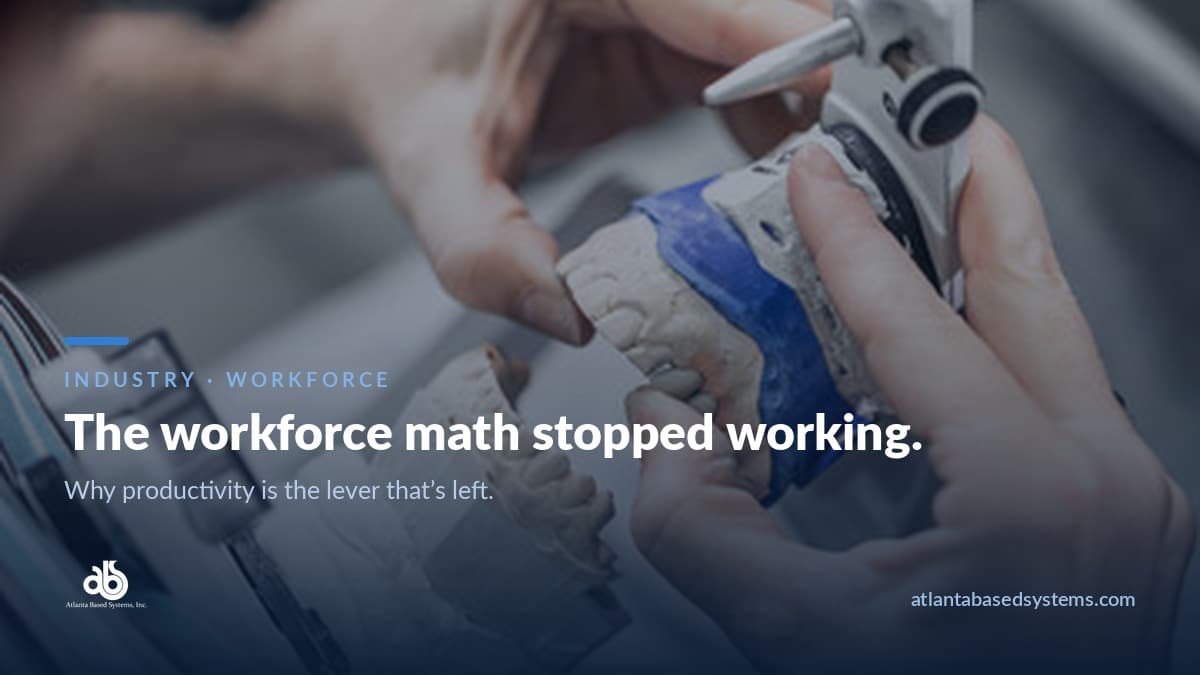
The dental lab workforce has declined by more than 30% since 2004. Restorative demand has not.

The numbers don’t describe a hiring problem

The Bureau of Labor Statistics projects employment for dental and ophthalmic laboratory technicians to decline another 1% through 2034. Over the same period it projects roughly 7,700 openings a year, almost all of them from retirements and people leaving the trade rather than from growth.

Read those together and you get an uncomfortable picture. The industry isn’t contracting because there’s less work. It’s contracting because the bench is aging out faster than it’s being replaced, and the training pipeline was never rebuilt to match.

Meanwhile the number of US dental labs keeps falling. Roughly 4,375 businesses remain, down about 1.6% annually over the last five years, in a market worth around $7.6 billion. Fewer labs. Fewer technicians. Steady demand.

Why the standard playbook is failing

Most labs are running the same response: post the opening, wait, raise the offer, wait longer, and eventually hire someone who needs six months before they’re carrying a full load.

That approach competes for a pool that shrinks every year. You can win it occasionally. You can’t win it structurally, and the labs that keep trying end up paying more for the same output while their competitors quietly get better at something else.

There’s a second cost that’s easier to miss. Every month spent waiting on a hire is a month of turnaround times you can’t commit to, accounts you can’t take on, and overtime that erodes the margin you were protecting.

The lever that’s actually available

The labs pulling ahead have mostly stopped trying to hire their way out. They’ve shifted attention to the space between the case arriving and the case shipping, the only part of this equation they fully control.

That means knowing where technician hours actually go. Not payroll hours. Production hours, by case and by step.

It’s a harder question than it sounds. Most labs know their monthly unit count and their labor cost. Far fewer can say, without building a spreadsheet first, how many hours a case consumed by department, which step is holding up WIP right now, or whose remake rate has been climbing for three months.

That’s rarely a matter of not caring. The data usually already exists somewhere in the lab’s system. What’s missing is a screen that puts it in front of someone who can act on it today rather than at month end.

Where the recovered capacity actually comes from

When labs start measuring this, the gains rarely come from technicians working faster. They come from removing the things that were never production in the first place:

Rework. A remake rate that’s tracked weekly gets addressed while the cause is still identifiable. One tracked quarterly gets absorbed as a cost of doing business.

Case hunting. Time spent locating a case, chasing a missing Rx detail, or asking who has the model is invisible on a timesheet and expensive in aggregate.

Bottlenecks nobody named. Most labs have one step that quietly sets the pace for everything downstream. It’s usually obvious once it’s measured and invisible until then.

None of that requires a hire. All of it requires visibility.

What this means for your lab

Before you write another job posting, answer one question honestly: how many hours per technician per week go to production, and where does the rest of the day go?

If you can’t answer it from your existing system in a few minutes, that’s the first thing to fix. Not because measurement solves the shortage; it doesn’t. But because you can’t recover capacity you can’t see, and recovered capacity is cheaper, faster, and more certain than a hire you can’t find.

See what this looks like in practice

If you’re running a lab and this sounds like your last twelve months, we’re glad to walk through how labs are tracking technician productivity and case flow at the step level: what’s worth measuring, and what’s just noise. No pitch, no commitment.

Grab fifteen minutes on the calendar and we’ll look at your lab specifically.

Book 15 minutes with Adam →

Prefer to send a note first? Contact us and we’ll take it from there.

Learn more about ABS and Evolution

Follow ABS on Facebook, Instagram, LinkedIn, and X. Please contact us directly if you’d like to learn more about Evolution dental lab management software.

Recent Posts
Archives