Month: September 2026

Ask a lab owner for their remake rate and most can give you a number. Four percent. Three and a half. “Under five, most months.”

It is a reasonable number to track. It is also one of the least useful numbers on the report, because of what it hides.

What the research actually found

A national study of single-unit crowns from the National Dental Practice-Based Research Network, published in the Journal of Prosthodontics, put the average remake rate at 3.8 percent. That matches what most labs would guess about themselves.

The distribution is the real finding. Individual dentists’ rejection rates ranged from zero to 42 percent. Fifty-eight percent of the dentists in the study rejected no crowns at all. Every rejection in the study came from the other 42 percent.

In other words, remakes were not spread thinly across everyone. They were concentrated in a minority of practices, and a blended average of 3.8 percent described almost nobody accurately.
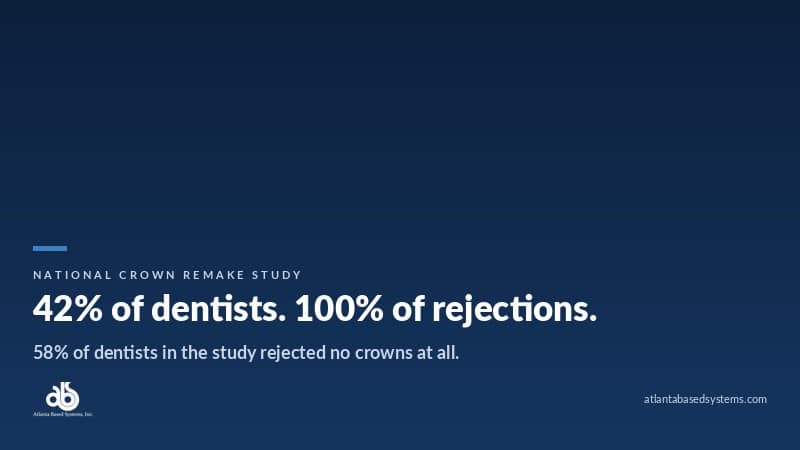
Stat card reading 42 percent of dentists produced every crown rejection in a national remake study

Why a single percentage sends you to the wrong fix

The same study listed the most common reasons crowns were sent back. Open proximal contacts came first, then open margins, then esthetic failure. Those three reasons have almost nothing in common when it comes to fixing them.

An open contact might be a model problem, a design setting, or a finishing habit. An open margin might be the bench, or it might be the impression that arrived. An esthetic failure is usually a communication problem: shade, photos, expectations. A lab that sees “remakes up this month” and responds with a general push on quality is treating three different problems with one blunt instrument.

The study also recorded what the dentist suspected had gone wrong. The most common answer was lab error, followed by distorted impressions and color mismatch. That is not a verdict. It is the default explanation when nobody has better information, and it tends to become the record unless the lab has its own.

Three questions worth answering every month

Before any remake conversation with a doctor, or any change at the bench, a lab manager should be able to answer three questions without building a spreadsheet.

Where are the remakes coming from? Rank accounts by remake count and by remake rate. The two lists are rarely the same. A high-volume account with a modest rate can produce more remakes than a small account with a terrible one, and they need different responses.

Which reasons keep repeating, and for whom? One account sending back open margins every month is a different conversation from an account whose remakes are all shade. Reasons only mean something once they are tied to the account.

Whose fault was it? Not to assign blame, but to decide who acts. Remakes that trace to the lab are a production issue. Remakes that trace to the prep or the impression are a doctor relationship issue. Most labs have a gut feel for the split. Very few can show it.
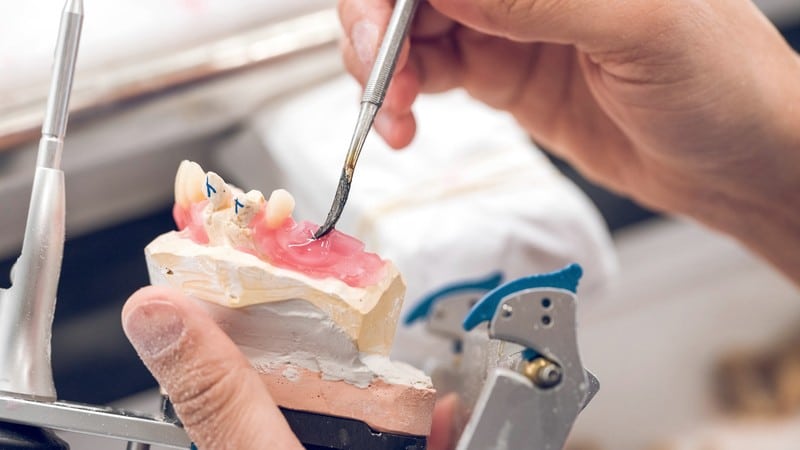
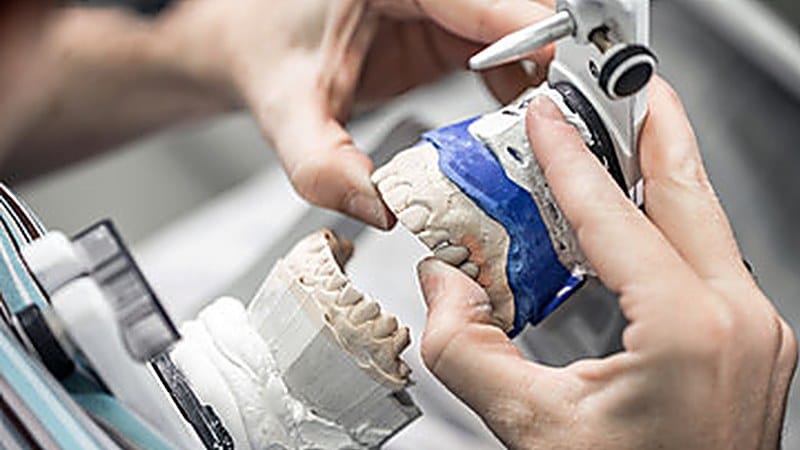
Dental technician setting a denture tooth in wax at the bench

Turning the numbers into a conversation

The value of knowing where remakes live is that it changes the tone of the call. “We have noticed a few remakes lately” invites a defensive answer. “Your office sent back six crowns this quarter, four for open margins, and all four were on cases where the impression was taken the same way” is a problem two professionals can solve together.

It also protects the relationships that are working. When a lab responds to a rising average by tightening everything, the accounts that never send anything back feel the friction too. Knowing that most remakes come from a few places lets the lab be precise instead of general.

This is the thinking behind the Remakes screen in EvoDASH, the dashboard that runs on a lab’s Evolution data. It shows remakes and repairs over time, splits remake fault between lab and doctor, lists the accounts sending the most remakes, and lets a manager click a day on the chart to see the cases behind it. The information is already in Evolution. The screen puts it where someone can act on it during the week rather than at month end.

What this means for your lab

Stop reporting remakes as one number. Report them as a short list: the top five accounts by remake count, the top three reasons, and the lab versus doctor split. Review it on a set day every month, with the person who talks to doctors in the room.

If the list surprises you, that is the point. The research suggests most of your accounts are not the problem. The job is finding the ones that are, and having the case history ready when you call.

See your own remake picture

If your lab runs Evolution and you would like to see what your remakes look like broken down by account and reason, we are happy to walk you through it.

Learn more about ABS and Evolution

Follow ABS on Facebook, Instagram, LinkedIn, and X. Please contact us directly if you’d like to learn more about Evolution dental lab management software.
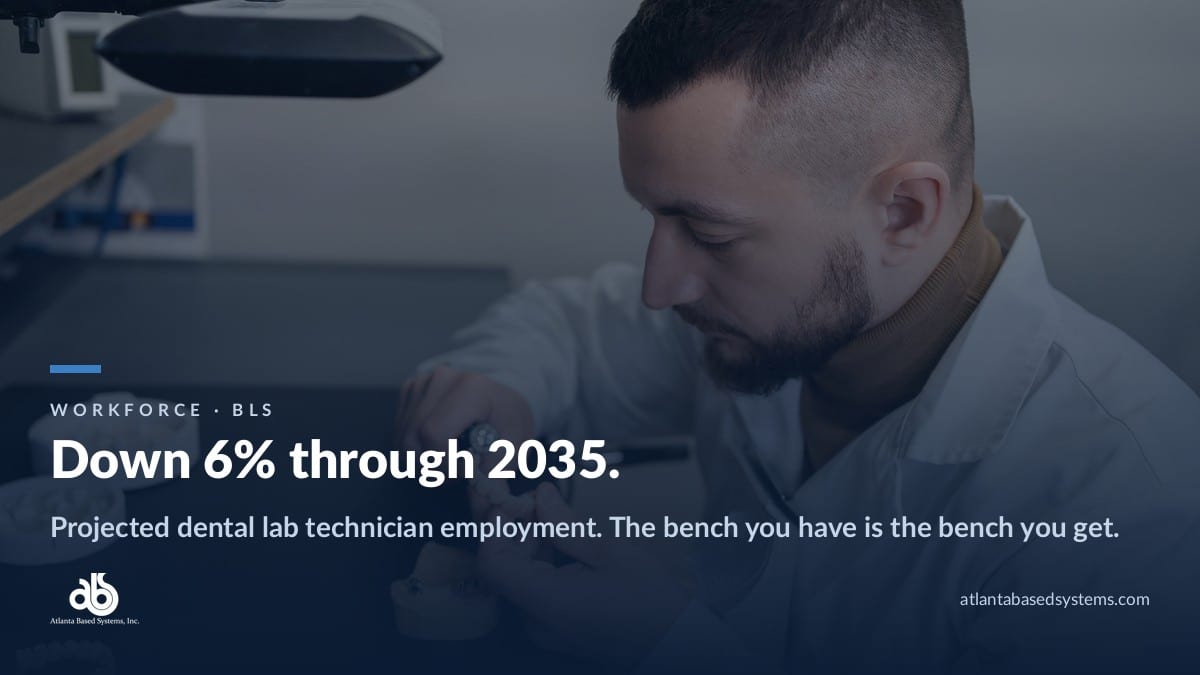
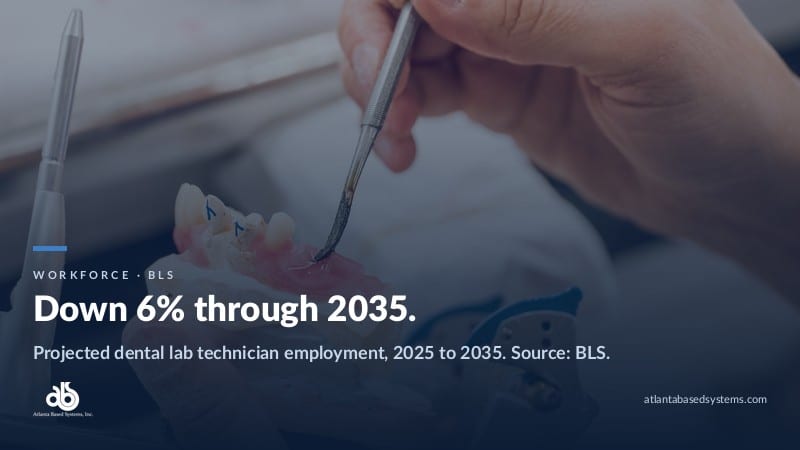
The Bureau of Labor Statistics refreshed its dental laboratory technician outlook on August 27. There are 34,400 people in the job. The projection through 2035 is a 6% decline, roughly 2,000 positions.

One note on reading the source, because the headline figure on that page is not the one that matters here. BLS groups dental laboratory technicians together with ophthalmic laboratory technicians and medical appliance technicians, and that combined group of 64,300 is projected to decline 2 percent. The dental laboratory technician line inside it is the one falling 6 percent, from 34,400 to 32,300. The other two occupations in the group are projected to grow slightly, which is what pulls the headline up.

Numbers like that usually get read as industry commentary and then filed. This one is worth reading as an operating constraint instead, because it describes the single input most lab capacity planning still takes for granted.

What the projection actually says

It does not say case volume is falling. Restorative demand is not the variable here. What the projection describes is the supply of people qualified to do the work, and it says that supply gets tighter every year for the next decade.

For most of the last thirty years, a growing lab could solve a capacity problem by hiring. It was not easy or cheap, but it was a solved category of problem. Post the role, wait, train, absorb the volume. Every plan for adding a major account has that step in it somewhere, usually unstated.

That step is the one getting less reliable. Not impossible, but slower and more expensive each cycle, with fewer trained candidates entering the field than leaving it. A growth plan whose second step is “and then we hire two more technicians” is now carrying a risk it was not carrying in 2015.

Stat card reading Down 6 percent through 2035, projected dental laboratory technician employment according to the Bureau of Labor Statistics

The automation explanation is half right

BLS gives a reason for the decline. The handbook attributes it to 3D printing and other laborsaving technologies being increasingly used to produce dental parts and appliances.

That is true as far as it goes, and it is easy to over-read. Printing and milling did not delete the labor. They relocated it, mostly upstream into design and downstream into quality control.

Somebody still builds the file. Somebody nests the tray, places the supports, runs the wash and cure, separates parts, and inspects a batch where a single upstream error means all forty units are wrong in the same way. The hours moved. They did not evaporate.

What did change is the shape of the risk. A technician hand-finishing one unit at a time makes small, contained mistakes. A technician approving a nest makes one decision that lands on forty units at once. Fewer seats, each carrying more consequence, each harder to fill.

Which means the practical conclusion for a lab is close to the opposite of the comfortable one. Automation does not reduce the hiring problem. It concentrates it.

The question that replaces “how many techs do I need”

If adding bench capacity is the unreliable move, the reliable move is knowing precisely what the current bench produces and where that production leaks.

Almost every lab can produce a case count and a payroll number. Those two figures bracket the problem without describing it. The useful measurements live between them, and most of them are not hard to capture. They are just rarely captured on purpose.

Units per technician per day, by department. A lab-wide average is close to meaningless, because it blends a department running at capacity with one that has room. The constraint is a specific bench on a specific day, and the average is designed to hide it.

Rework rate, broken out two ways. By technician, and separately by account. Remakes are almost never evenly distributed. They concentrate, and the concentration usually has a nameable cause: one technician who needs a specific piece of training, or one practice whose impressions or scans consistently arrive short. Both are fixable. Neither is visible in a lab-wide remake percentage.

Where cases actually sit, versus where the schedule says they should be. The distance between those two is most of a turnaround problem, and it is the number that gets estimated rather than measured most often.

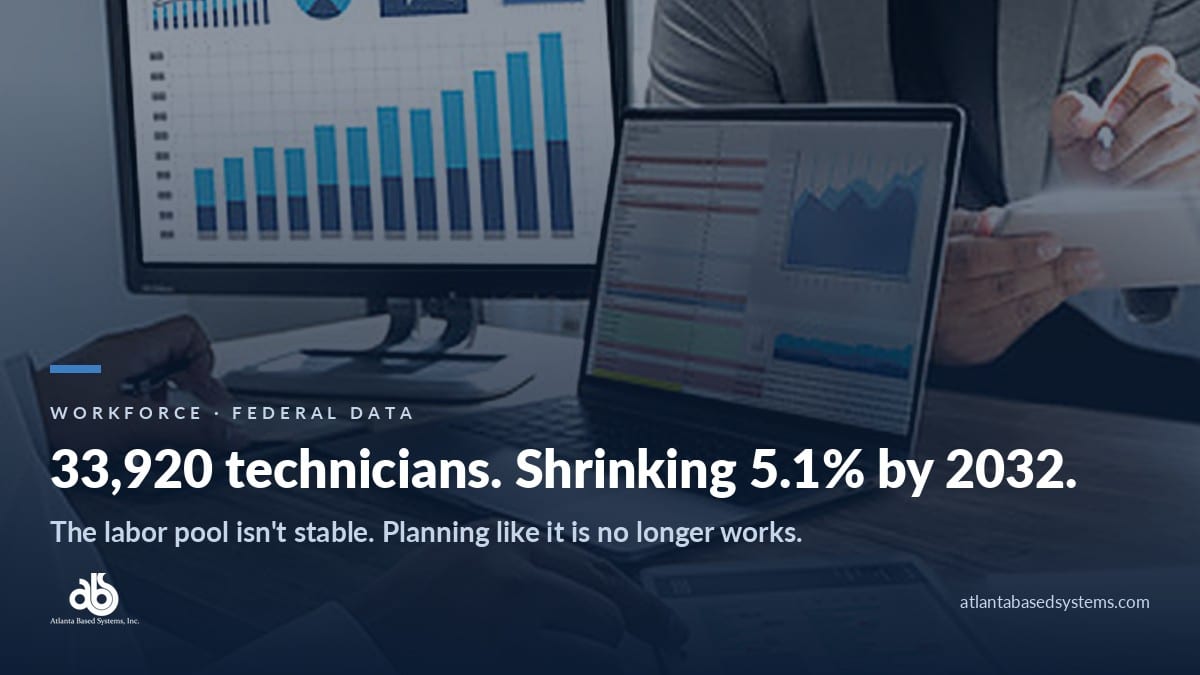
EvoDash technician detail screen showing units completed over the last 30 days and completed production steps broken out by day

Why this has to be a byproduct, not a project

Here is where most measurement efforts die. Somebody decides the lab needs these numbers, builds a spreadsheet, and asks the floor to feed it. It works for five weeks. Then a busy month arrives, the tally slips, and the data quietly stops being trustworthy right at the moment it would have been most useful.

The version that survives is the one where nobody is asked to do anything extra. Production data has to fall out of moving the case through the lab, so that the report is a lookup rather than a project. If producing the number requires someone to stop and record it, the number will be missing exactly when the lab is busiest, which is the only time anyone needs it.

That is the argument for a system of record rather than a reporting habit. It is also the reason to put one in place before you need the answer, not during the quarter you are trying to fix something.

One test worth running this week

Pick last Tuesday. Answer three questions without asking anyone on the floor.

Which department completed the fewest units relative to what was scheduled into it. Which account generated the most rework in the last ninety days. How many cases were sitting past their promised date at 4pm.

If those are lookups, your capacity planning can be built on real numbers, and the BLS projection is a hiring headwind rather than a strategic threat. If any of them requires a walk through the lab and a conversation, that gap is the thing worth closing first. It will matter more every year that projection holds.

See what this looks like in practice

If you want to see how case tracking, technician productivity and turnaround reporting work together in one system, we are happy to walk through it with no pressure and no obligation. Evolution has been built around dental labs for close to fifty years, and a short conversation is usually enough to tell whether it fits how you already work.

Learn more about ABS and Evolution

Follow ABS on Facebook, Instagram, LinkedIn, and X. Please contact us directly if you’d like to learn more about Evolution dental lab management software.
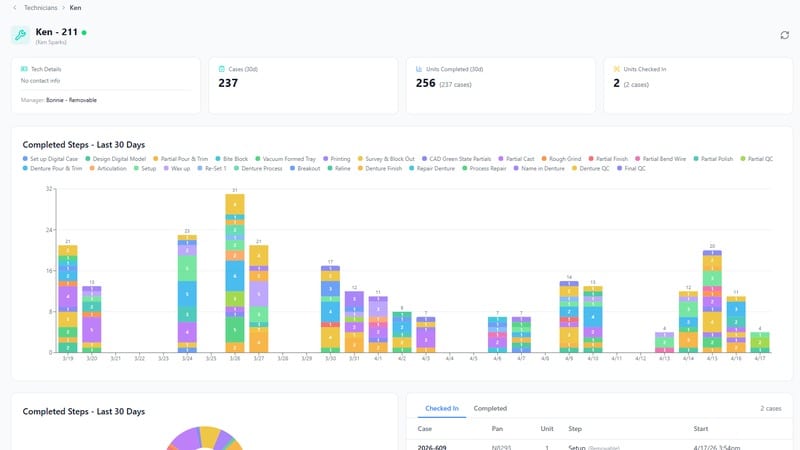
There are 33,920 dental laboratory technicians working in the US right now. According to federal labor projections, that number is expected to shrink by 5.1% over the next several years, even as the overall job market keeps growing. Roughly 150 openings a year get created nationally, and almost all of them come from people leaving the field, not from new positions being added.

That’s worth sitting with for a second, because it changes the question labs should be asking. This isn’t “how do we hire our way out of a tight quarter.” It’s a structural, multi-year contraction in the number of people who can do this work at all.

Why “just hire more” stops working

Most labs still plan staffing the way they always have: when volume goes up, post a job, wait for applicants, train them in. That approach assumes the labor pool is roughly stable and just needs the right recruiting push.

Dental lab technician finishing a denture at the bench, hands working on a model

The federal data says that assumption is wrong. The pool itself is getting smaller. A lab competing for a shrinking group of qualified technicians against every other lab in the region isn’t solving a hiring problem with a better ad. It’s competing for a resource that federal projections say keeps declining through the early 2030s.

What actually moves the needle instead

If you can’t reliably add technicians, the only lever left is getting more out of the ones you already have, and that starts with actually knowing what they’re producing.

Most labs can tell you total case volume for the month. Far fewer can tell you, in the moment, what any individual technician has finished today, where a specific case is sitting right now, or which step in the workflow is quietly eating the most time. Without that visibility, “we need more people” becomes the default answer to every capacity problem, even when the real issue is a bottleneck two steps upstream that’s invisible without real-time data.

Lab manager reviewing production charts and dashboards on a laptop at a desk

Labs that track technician output and case status in real time aren’t immune to the shortage. But they’re not flying blind through it either. They can see where a backlog is actually forming, decide whether it’s a staffing problem or a workflow problem, and make that call with data instead of a hunch.

See what’s coming for your lab

The technician shortage isn’t a headline that will pass. It’s a demographic trend with a multi-year runway, and it’s already shaping which labs can take on more cases and which ones are stuck turning work away. The labs that come out ahead won’t be the ones who found more technicians. They’ll be the ones who knew, day to day, exactly where their existing team’s time was going.

If you’ve been running on gut instinct about what your technicians are producing, we’d be glad to walk through what a real setup looks like for a lab your size. Contact us

Learn more about ABS and Evolution

Follow ABS on Facebook, Instagram, LinkedIn, and X. Please contact us directly if you’d like to learn more about Evolution dental lab management software.
There is a call every dental lab in America takes several times a day. An office rings in and asks where a case is. Someone at your lab puts them on hold, walks to the bench or opens a screen, finds the case, walks back, and reports. The call takes four minutes on your end. It took four on theirs too.

Nobody logs it. Nobody costs it. It does not show up on any report you run at month end. And it is, on a per-minute basis, one of the most expensive things happening in your building, because both sides of that call are paying for information that already existed.

Two findings from the ADA’s Health Policy Institute make the case better than any lab software vendor can.

What is actually happening in your customers’ offices

The Health Policy Institute’s Q2 2026 update on the dental economy does not bury its finding. It titles the chart “Dentists are Busier in Q2 2026.” Chairs are fuller than they were the quarter before.

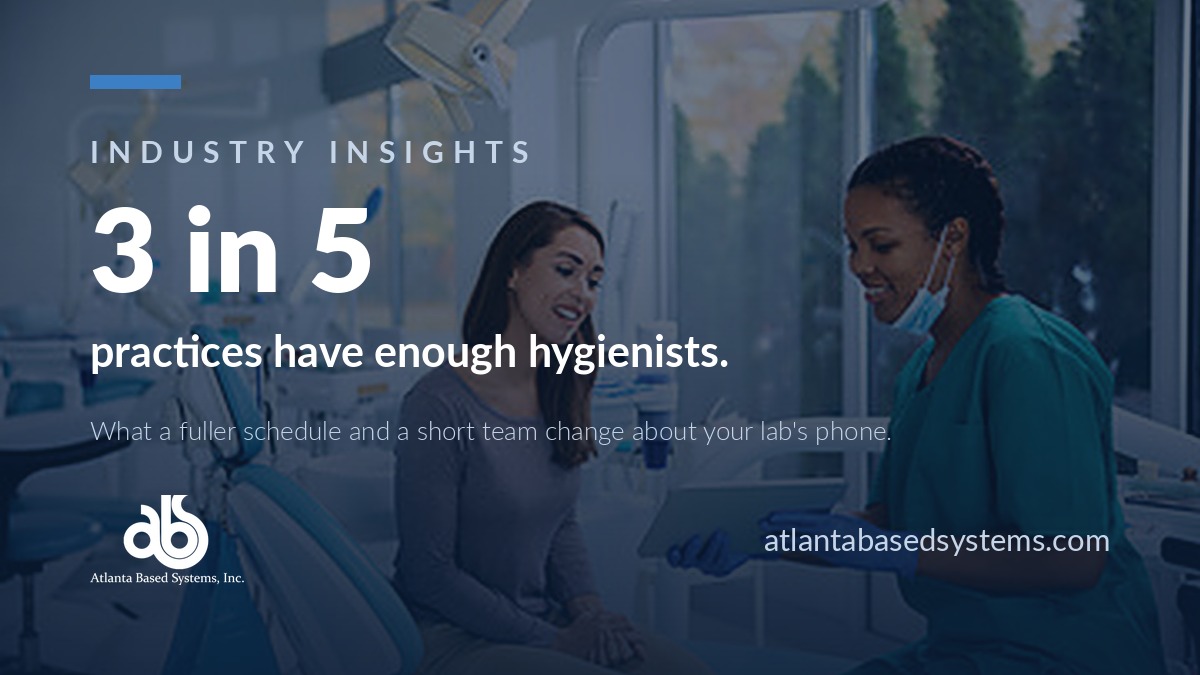
That reads like good news for everyone, and for the lab it partly is. More production. But look at what the same research says about who is in the building to handle it. Dental hygienists are the hardest role in a practice to recruit, in the Q2 update and the Q1 one before it. As of the Q1 read, only around three out of five dentists said they had an adequate number of them.

Hold those side by side. The practices your lab serves are running fuller schedules with a team they cannot easily add to. Every person in that office is absorbing more than they were six months ago.

The scarcest resource in a dental office right now is not chair time. It is anybody’s spare attention.

That is the person calling your lab about a case.

The math nobody runs

Say a mid-sized lab takes twenty of these calls a day. That is a conservative figure for a lab with a healthy account base, and larger labs will recognize it as low.

Twenty calls at four minutes is eighty minutes a day on your side. Call it seven hours a week, a third of a full-time position, spent transmitting information rather than producing anything. Then double it, because the same eighty minutes was spent inside practices that are running fuller schedules with a team they cannot easily add to.

The cost that matters is not the wage. It is what the call signals. A practice that has to call you to find out where a case is has learned that working with your lab requires labor. They may never say that out loud. They will not file a complaint about it. But when a competitor’s rep walks in and says their offices can see case status themselves, that practice already knows exactly what problem is being solved.

What actually removes the call

Labs tend to reach for the wrong fix here. A better phone system does not remove the call. A dedicated customer service seat does not remove the call, it just staffs it. Even a portal does not remove the call by itself, if the portal shows a status somebody has to remember to update.

What removes the call is a case status that is current because the production system is current. When a case moves through the lab, its state changes on its own, and the office can see it: accepted, scheduled, in process, complete, or on hold. No login queue, no callback, no waiting for someone at the lab to be free. Available at eleven at night, when the question actually occurs to the person who has to plan tomorrow’s schedule.

That is what a doctor portal is for. In Evolution, that portal is EvoDOCTOR, and it does one thing beyond call deflection that is worth understanding.

Every action a doctor takes in the portal, submitting a case, adding a note or an image, requesting a pickup, is recorded automatically as a CRM activity against that account. No one at your lab types it. The result is an account history that reflects what the doctor actually did rather than what a staff member remembered to write down. Six months later, when an account goes quiet and somebody asks what changed, the record is there.

For labs that want it under their own name, EvoDOCTOR can be published as the lab’s own branded app on iOS and Android.

The question to take into next week

Do not start with software. Start with a count.

For one week, have whoever answers the phone put a tally mark on a sheet of paper every time a call is only about where a case is. No categories, no system, just the mark. At the end of the week you will have a number you have never had before.

Whatever that number turns out to be, it is the size of a problem you are currently paying for twice: once in your own labor, and once in the patience of front desk staff at practices that do not have any to spare.

Learn more about ABS and Evolution

Follow ABS on Facebook, Instagram, LinkedIn, and X. Please contact us directly if you’d like to learn more about Evolution dental lab management software.
Recent Posts
Archives